
 EN
EN
 ar
ar bg
bg hr
hr cs
cs da
da nl
nl fi
fi fr
fr de
de el
el hi
hi it
it ko
ko no
no pl
pl pt
pt ro
ro ru
ru es
es sv
sv tl
tl iw
iw id
id lv
lv lt
lt sr
sr sk
sk sl
sl uk
uk vi
vi et
et hu
hu th
th tr
tr fa
fa ms
ms hy
hy ka
ka ur
ur bn
bn mn
mn ta
ta kk
kk uz
uz ku
ku
Visualization Software
Kingmach Visualization Software refers to the Monitoring system software platform, also described in the local files as the Cloud Platform. It is based on Internet of Things, big data, and cloud computing technologies for all-round monitoring of civil engineering structure safety. The platform receives data from monitoring devices, stores it, filters it, analyzes it, displays it, and supports project management. It is intended for infrastructure and engineering assets where multi-source readings need to be reviewed together instead of scattered across separate devices or spreadsheets.
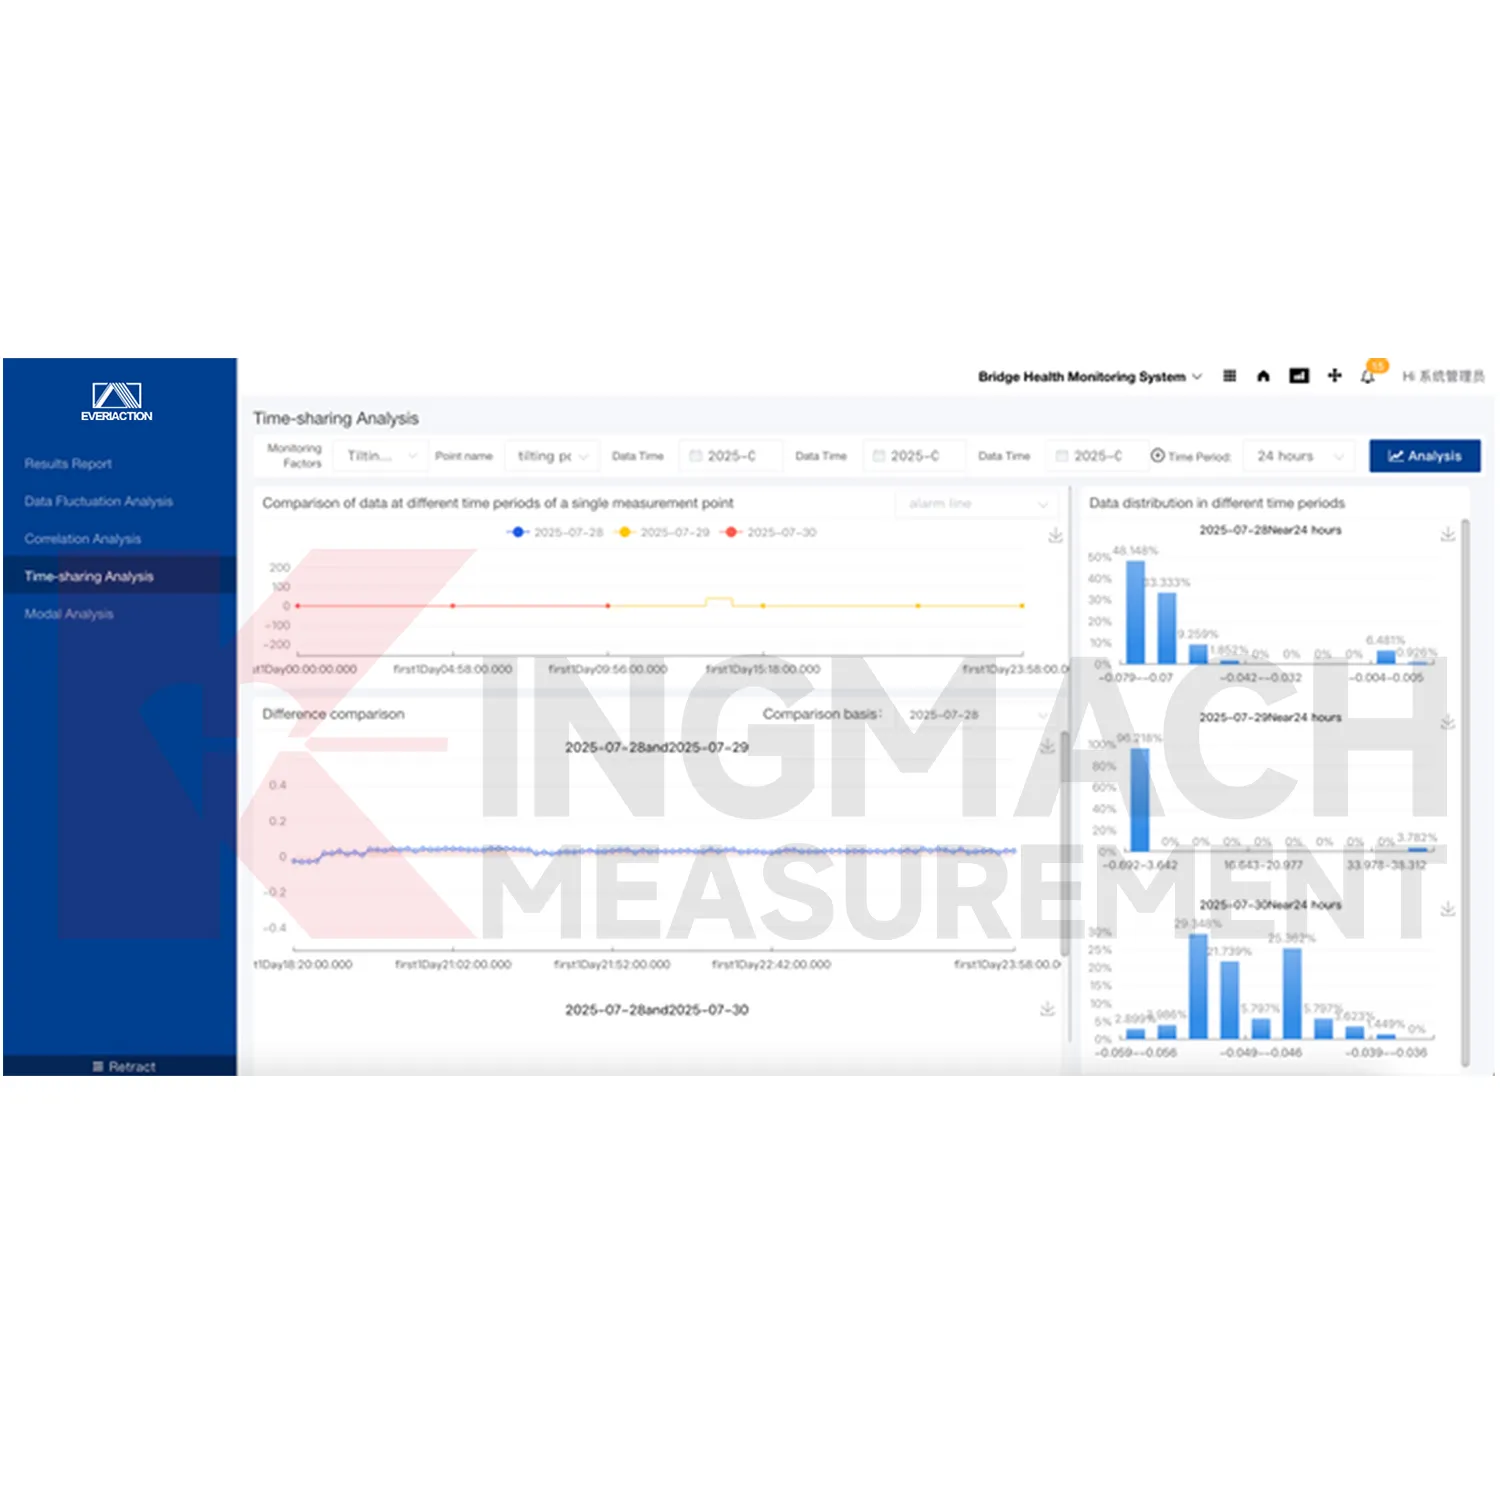
Application of Visualization Software
Multi-site asset management uses Kingmach Visualization Software when an owner needs consistent monitoring records across several projects. Each project can keep its own basic information, dynamic information, alarm levels, documents, and maintenance records while still following a common digital workflow. This is useful for infrastructure owners, engineering firms, and maintenance teams that manage bridges, tunnels, slopes, buildings, and hydraulic structures at the same time. Standardized visualization and reporting make cross-project review more efficient.
The future of Visualization Software
Digital twin projects will use Kingmach Visualization Software as the live data layer behind structural models. A twin needs current readings, historical trends, device identity, alarm status, and inspection records to stay meaningful. The platform can help feed that model with organized monitoring data from many instrument types. When a bridge, tunnel, dam, building, or slope changes, the twin can be updated with both sensor evidence and field notes, making the virtual record closer to the real asset condition.
Care & Maintenance of Visualization Software
Alarm rules in Kingmach Visualization Software should be reviewed by engineering staff, not copied blindly across every point. Different structures, sensors, and risk levels need different alarm logic. A settlement point, strain point, water-level point, and tilt point may require different thresholds, rate checks, and response procedures. After the first operating period, review alarm history and adjust rules where ordinary behavior is creating unnecessary alerts or where a critical pattern needs faster attention.
Kingmach Visualization Software
Kingmach Visualization Software is built around IoT, big data, and cloud computing technologies for civil engineering safety monitoring. Devices can transmit data to the Cloud Platform through wired or wireless means, allowing mixed field networks to feed a shared review environment. The platform is described as compatible with hardware devices from different manufacturers, different types, and different models. This is useful for owners who already have existing instruments or who need to expand a site in stages. The software layer helps connect new and old monitoring equipment into one readable data environment.
FAQ
Q: What is Kingmach Visualization Software?
A: It is the Monitoring system software platform, also described as the Cloud Platform, for data integration, analysis, visualization, alarms, reporting, and project management.
Q: What technologies does it use?
A: The platform is based on Internet of Things, big data, and cloud computing technologies.
Q: What does the platform monitor?
A: It supports all-round monitoring of civil engineering structure safety across assets such as bridges, tunnels, slopes, dams, buildings, and foundation pits.
Q: Can it connect different devices?
A: Yes. The local product file says it can access hardware devices from different manufacturers, types, and models.
Q: How do devices send data?
A: Devices can transmit data to the Cloud Platform through wired or wireless means.
Reviews
Matthew Garcia
Instrumentation cables are durable and perform well even in harsh environments. Will definitely order again.
Daniel Brown
Excellent environmental monitoring sensors. The data is consistent, and the system integrates smoothly with our existing setup.
Latest Inquiries
To protect the privacy of our buyers, only public service email domains like Gmail, Yahoo, and MSN will be displayed. Additionally, only a limited portion of the inquiry content will be shown.
Amelia***@gmail.comSingapore
Hello, I am looking for visualization software for monitoring system data analysis. Please let me kn...
Evelyn***@gmail.comSouth Africa
Hi, we are a contractor working on tunnel construction and need settlement sensors and displacement ...
Related product categories
- Monitoring Software Suite
- Monitoring system software platform
- Environmental Monitoring
- Visualization Software
- GPS Displacement Monitoring System
- Integrated Monitoring Station
- Settlement Monitoring Rod
- Structural Health Monitoring (SHM) System
- Structural Monitoring Cloud Platform
- IoT Online Monitoring System
- Monitoring System Platform & Services
- Engineering Pulse Intelligent Monitoring Cloud Platform